Montana today could be a more prosperous state. Through investments by our state, we could have more modern schools, better roads, updated water and sewer systems, and a greater access to a college education.
Our state does not have these things – not because of a natural disaster or a financial crisis brought on by things out of the state’s control. Instead, Montana is not the state it could be because of the decision made in 2003 to sharply reduce taxes. These tax cuts that mostly benefited the wealthiest Montanans have cost the state nearly $1 billion in one decade.
What could that $1 billion have bought?
Tax cuts that were sold in 2003 as a way to help the state’s economy have had the opposite effect. These tax cuts did little to grow the economy. Instead, Montana’s vast network of roads and bridges are crumbling. Montana’s children enter schools with leaking roofs, failing heating systems, and without the most modern technology. More families are struggling, with one in five Montana children living in poverty.[1] And more and more families and young Montanans face insurmountable levels of debt to get a college degree.
It’s not too late to turn things around and plot a course back to being a state that makes the public investments it takes for communities to thrive. Lawmakers should:
Every day, every week, every year that Montana forgoes more revenue, the state moves farther away from being a place where we all can prosper. Having enough state revenue to adequately invest in our communities and our residents is critical for our state to be one where we can all live, work, play, and improve our lives.
Montana has sacrificed revenue through tax cut measures aimed at the wealthiest
· Reduced the number of tax brackets from 10 to 6.
· Lowered the top bracket rate from 11% to 6.9%.
· Reduced the income at which the top rate is effective from $82,400 to $13,900
· Reduced the effective tax rate on capital gains through a 2% credit.
· Capped the allowable itemized deductions for federal income taxes paid at $5,000 for single and $10,000 for married filing jointly.
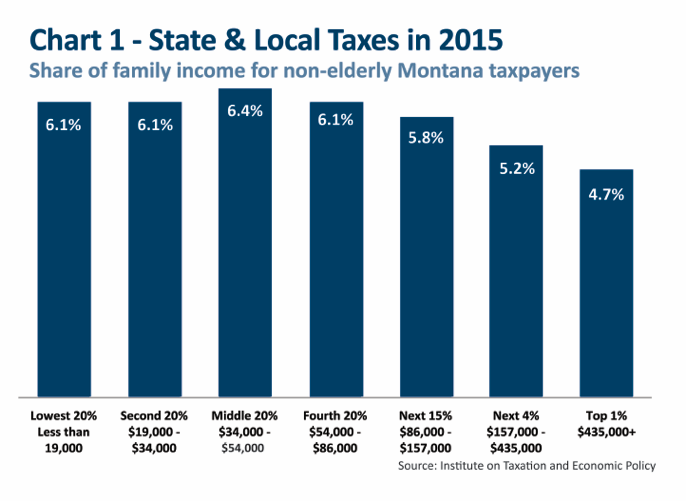
In Montana, the higher a household’s income, the lower share of that income it tends to pay in state and local taxes [see Chart 1]. One reason for this is that people who make less money end up paying a larger share of their income in local sales taxes and property taxes. An income tax with a graduated rate structure helps offset this to an extent -- as income goes up, the rate someone pays goes up too. Reducing the top income tax rate and reducing the number of rates not only reduces the revenue coming into the state, but also makes the overall tax system less equitable.
Nearly half of the 2003 tax cuts went to the wealthiest 1%
By 2009, more than half the tax cuts, nearly 54%, went to the top 1% of taxpayers – those with annual income over $500,000.[8] In 2009, the wealthiest 1,829 households reaped the benefit of $39 million in tax cuts, at an average of $21,384 per person, which is about the average annual wage of a home health aide worker in Montana.[9],[10]
Supporters claimed the tax cuts would benefit all Montanans. However, it is clear now that the vast majority of Montana families saw little or no benefit. In 2008, Montana workers earning between $20,000 and $65,000 received an average tax cut of just $11.[11]
While the wealthiest saw dramatic tax reductions, nearly one in five Montana taxpayers actually saw their taxes increase.[12] Once again, middle-income households were more likely to be affected than wealthy households. Nearly one-third of households with income between $25,000 and $80,000 a year saw an increase in taxes. Less than one-fifth of households over $300,000 saw a comparable increase.[13]
The trend of the 2003 law disproportionately benefiting the wealthiest continues today. From 2005 to 2016, the wealthiest 1% of Montanans received over $536 million (or 55%) of the tax cuts brought about by the legislation.[14] Montana families earning between $25,000 and $60,000 have seen almost no benefit at all.[15]
Montana values wealth over work through capital gains tax break
Capital gains are profits from the sale of certain types of assets, such as stocks, bonds, and real estate. As these assets become more and more valuable, the owner does not pay taxes on this added value until the asset is sold.
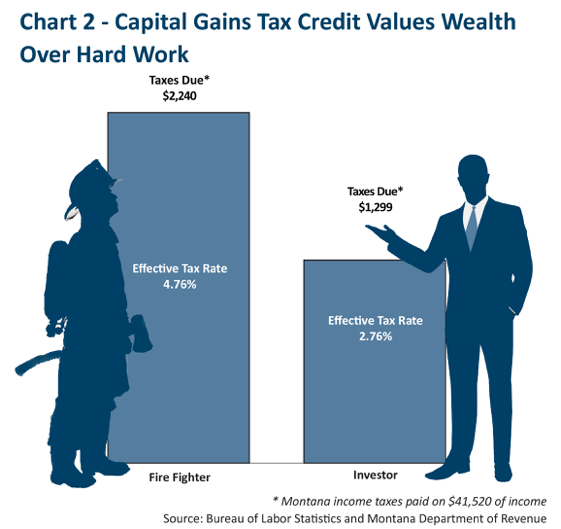
The capital gains tax break favors wealth over work. Chart 2 illustrates the different taxes paid by two individuals with the same amount of income. In 2015, a firefighter in Montana earned an annual wage of $47,050.[17] Compare this taxpayer to an investor who earned the same amount, but through the sale of stock. The firefighter paid $2,240 in state income taxes, and the investor paid $1,299. The investor paid $941 less in taxes, or 42%, than the firefighter.[18]
Those earning more than $500,000 benefit the most from the capital gains tax break
The capital gains tax cut continues to benefit a narrow slice of the wealthiest population, at great cost to Montana’s ability to invest in public services that benefit all Montanans. While the lower rate applies to every taxpayer regardless of income, the fact is that low- and middle-income households most often earn their income from wages, rather than selling assets such as stocks and bonds.[19] The assets owned by everyday Montanans – houses and retirement income – are generally exempt from taxation when sold.
Because the vast majority of Montanans cannot take advantage of this lower tax rate, the benefits go to the wealthiest in the state. In 2014, half of the capital gains tax cut went to the wealthiest 4,500 taxpayers (those earning more than $365,000).[20] In 2013, over 85% of Montana taxpayers – more than 468,000 taxpayers – did not receive any benefit from the capital gains credit.[21]
Furthermore, profits from capital gains have increased significantly since 2001. From 2001 to 2005, capital gains income by Montana taxpayers almost doubled, to over $1.5 billion.[22] By 2005, capital gains represented nearly a quarter of total income accrued by those making more than $200,000 (less than 10,000 taxpayers).[23] While capital gains income has increased over the past decade, the state loses out on its full opportunity for additional revenue as a result of the capital gains tax break.
Montana has lost nearly $1 billion in revenue due to tax cuts and tax loopholes for the wealthy
In addition to the fact that the wealthiest households pay less in Montana taxes than they used to, the significant reduction in revenue hurts Montana’s ability to support schools, infrastructure, and social services, which affects middle-income families and those struggling to get by.
In the first year of full implementation of the tax cuts, the actual loss in revenue exceeded legislative projections by nearly four times the original estimate. Originally the legislature had estimated the tax breaks would cost the state about $26 million in lost revenue; however, the actual cost in 2005 exceeded $100 million.[24] This was due, in part, to income – particularly capital gains income – growing at a greater rate than predicted. Income growth from 2003 to 2007 disproportionately went to the highest-income taxpayers, who then received a much bigger tax break than predicted, while lower income taxpayers received less than estimated.[25] The tax cuts for those earning more than $500,000 were seven times greater than projected in 2003, representing total revenue loss of nearly $48 million.[26]
While there were measures included in the 2003 tax cut bill designed to make up for lost revenue, they have not generated nearly enough revenue to cover the cost of tax cuts to the wealthy. In the short term, the law tried to partially make up for the lost revenue by implementing a sales tax on accommodations and rental cars, by increasing taxes on cigarettes and other tobacco products, and by capping the tax deduction allowed for federal income taxes paid.[27] The Montana Department of Revenue estimated these new revenue sources would bring in approximately $42 million in 2009, compared to the more than $86 million in lost revenue due to the income tax cuts targeted to the wealthy.[28] The levels of revenue the state received from these measures would not keep up with the levels of revenue lost from tax cuts for the wealthy.
A major portion of the continued revenue loss is attributed to the capital gains tax credit, primarily benefiting the wealthy. By 2007, the cost of the capital gains tax break reached $40 million per year.[29] While earnings through capital gains dipped during the recession, these earnings have been growing since 2012, representing a significant loss in revenue year over year. In 2013, the state lost nearly $30 million in revenue as a result of the capital gains tax loophole.[30]
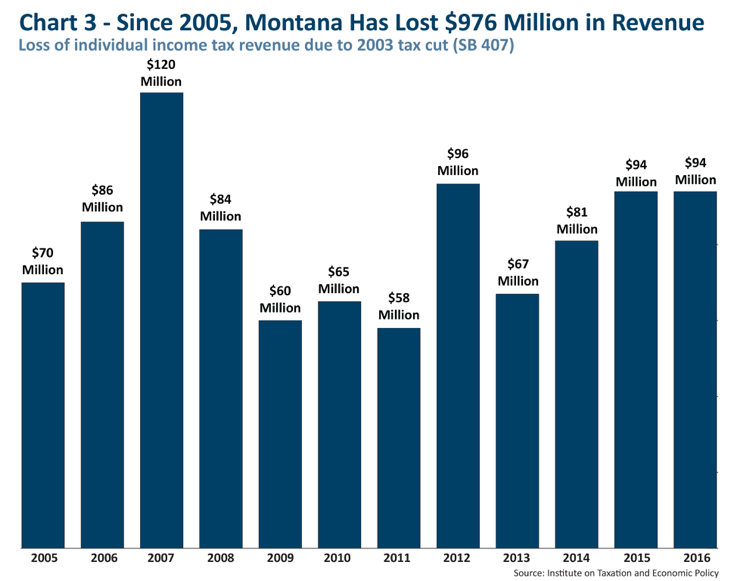
In the past decade, Montana has lost approximately $976 million in revenue, from the tax cuts from 2003.[31] While loss in revenue dropped in the years of the Great Recession, the annual loss in revenue has been growing each year since 2013 [see Chart 3].
Tax cuts for the wealthy do not grow our economy
While Montana’s economy has grown over the past decade, research makes it clear that this growth is not a result of tax cuts. The claim of some legislators that supported the 2003 tax cuts for the wealthy that these measures would grow the economy and result in higher revenue is simply not the case. The Montana Department of Revenue concluded, in 2013: “it is unlikely that [the 2003 tax cut] had a significant short-run stimulus effect,” stating instead that the law primarily redistributed tax obligations rather than reducing them.[32] The then-director of the Bureau of Business and Economic Research at the University of Montana stated the data on whether the tax cuts had a statistically significant impact on economic growth was “simply inconclusive.”[33]
In an analysis of the impact of the 2003 legislation, comparing economic growth in Montana to surrounding states, Montana Budget and Policy Center found, at most, negligible evidence that the economic growth Montana experienced over the past decade could be attributed to tax cuts.[34] MBPC measured whether the 2003 tax cuts had a statistically significant change in the actual growth in Montana’s economy by comparing the state’s economy with regional data in such areas as the unemployment rate, income per capita, jobs, wages, or gross state product, several years out.[35] Instead, Montana continues to lose nearly a hundred million dollars in revenue each year that could instead be invested in our local communities.
Dozens of highly credible economic studies around the country show that there is little connection between cuts in individual income taxes for the wealthy and economic growth in either the short or long run. A comprehensive review conducted by the Center on Budget and Policy Priorities noted that of the 15 major academic studies on income tax cuts conducted since 2000, 75% found no significant economic effect of these tax cuts.[36] Since enacting the cuts, most states have actually had slower job growth than the nation as a whole and have seen their share of national employment decline.[37]
Rather than continuing the failed policy of tax cuts, our best opportunity to realize economic growth in Montana is to invest in our communities, through strengthening support for K-12 education, expanding access to post-secondary education and training, supporting families struggling to make ends meet, and increasing good-paying jobs and business growth through investments in public infrastructure. One of the best ways we can ensure adequate state revenue and begin to properly invest in our communities is by ensuring that Montana’s wealthiest households pay their fair share.
Montana could make greater investments to help families and communities
The quality of life we enjoy is directly connected to the public investment made over many decades. Our parks and trails, quality schools, and reliable roads make our communities great places to live and work. Unfortunately, Montana has reduced its investment in the common good. This failure to invest is leaving the next generation with crumbling infrastructure, a college education that is out of reach for many, and a public education system struggling to provide a 21st century learning experience. The state can and should raise the revenue needed to invest in helping communities thrive and building a strong state economy.
Montana’s Investment in K-12 Education Falls Behind
Investment in K-12 education serves two important purposes. Immediately, supporting K-12 education boosts local economies in every corner of the state by promoting good-paying jobs for teachers, support staff, bus drivers, and many more professionals. In the long run, increased investment in education improves student achievement and boosts the quality of Montana’s workforce and economy.
Montana’s K-12 schools face significant challenges in maintaining buildings and equipment needs to accommodate enrollment levels and growing technological improvements. The most recent facility assessment by the Montana Department of Administration, in 2008, showed over two-thirds of all K-12 schools were built prior to 1970.[40] An independent assessment also done in 2008 estimated that Montana K-12 schools had over $903 million in deferred maintenance needs, including heating and cooling, roofing and insulation, and electrical updates.[41]
“Infrastructure represents a large portion of our educational concerns in Montana. [We] are doing the best we can to safely and productively educate our youth with facilities that are stretched beyond their productive lives.”
~ Testimony in support of Quality Schools program (2015)
In the 2015 legislative session, the bipartisan infrastructure package, which failed to pass the House, included $30 million for the Quality Schools program, a funding stream administered by the Department of Commerce to help repair school facilities.[42] This proposal included much-needed repairs for schools across the state, including heating and ventilation upgrades, new roofing, and classroom expansions and upgrades.
Without the 2003 tax cuts, Montana would have had revenue sufficient to cover the entire cost of school facility needs. In fact, the total loss in revenue to the state over the past decade would have covered the full cost of deferred maintenance needs of Montana schools.
The Legislature’s failure to invest in infrastructure improvement has left Montana communities struggling
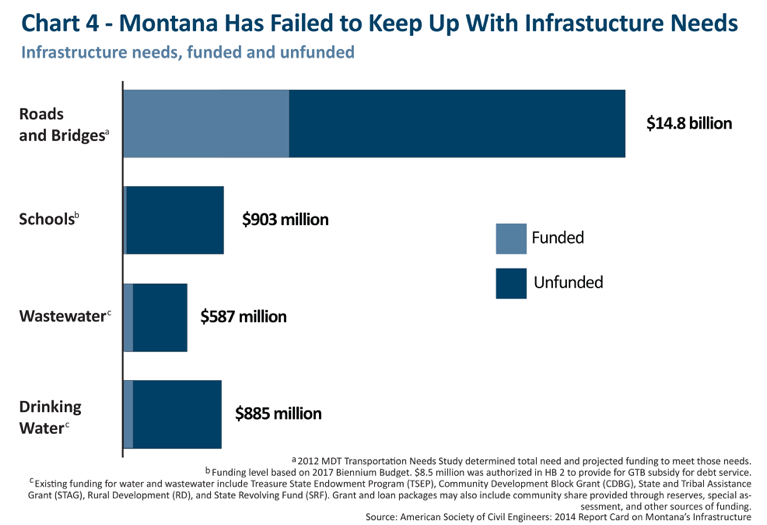
Infrastructure needs encompass a variety of critical areas, from having quality school facilities to water and wastewater systems, to improving the conditions of our roads and bridges. The American Society of Civil Engineers (ASCE) provides the most comprehensive look at infrastructure needs in each state. ASCE grades the condition of Montana’s infrastructure as C-minus, with significant backlog in projects related to school facilities, wastewater systems, and roads and bridges [see Chart 4].[43]
Montana also faces significant and urgent needs to rebuild wastewater, or sewer, systems. Approximately 55% of all public wastewater systems in Montana report zero capacity for growth, with many located in growing communities across the state.[44] ASCE estimates the cost of replacing Montana’s water and wastewater infrastructure at $12 billion to $15 billion.[45]
Montana also faces significant and urgent needs to rebuild wastewater, or sewer, systems. Approximately 55% of all public wastewater systems in Montana report zero capacity for growth, with many located in growing communities across the state.[46] ASCE estimates the cost of replacing Montana’s water and wastewater infrastructure at $12 billion to $15 billion.[47]
Montana also faces severe needs in building the capacity of drinking water systems across the state. Many city and town water pipes are 75 to 100 years old.[48] While federal and state programs, such as the State Revolving Loan Fund, Community Development Block Grants, and Treasure State Endowment Program provide local governments some assistance, the needs far outweigh available funding sources.
Montana’s vast network of highways and roads continues to face dire conditions with the legislature’s failure to invest in long-term infrastructure needs. ASCE estimates nearly half of all major roads in Montana are in poor to mediocre condition.[49] These conditions are estimated to cost each Montana motorist in urban areas $484 annually in vehicle operating costs such as repairs, increased fuel consumption, and tire wear. Federal, state, and local resources meet only about 25% of the amount needed to care for Montana’s roadway system, totaling over $14 billion. The Montana Department of Transportation reports the state falls short by $1 billion a year in the cost of maintaining Montana’s highway system.[50] Furthermore, ASCE estimates that communities across Montana are meeting only 17% of public transit needs, particularly in more urban settings.[51]
Montana’s children lack early education, as the state continues to lag behind on investments in Pre-K
Investing now in kids and early childhood development strengthens our communities and our economy. Quality, public pre-K provides greater preparation for children entering kindergarten and provides working parents with the peace of mind that comes from knowing their kids are in a safe place. Pre-K has the long-term benefits of reducing education costs, increasing future earnings of participants, and reducing the state’s spending on corrections.
And yet, Montana is one of only eight states that does not invest in its youngest learners.[52] Child care in Montana is expensive: the average cost for a four-year-old to attend child care is $7,518 a year, roughly 13% of the average Montana family’s yearly income and more than one-fourth of the average income for a single mother.[53] The cost of child care for a four-year-old now exceeds the annual cost of tuition at a Montana university.
In 2015, Legislators failed to pass a proposal to invest in developing and strengthening public pre-K programs for four-year-olds. While some school districts across the state provide pre-K to some students, the demand far outweighs the current supply.[54] Many school districts have been unable to provide pre-K, leaving many children without quality childhood development. A state investment would provide local communities and public schools the opportunity to develop pre-K programs (or expand existing pre-K). The tax cuts aimed at the wealthiest 1% (nearly $48 million in 2015) would more than cover the annual investment needed to provide high quality, pre-K for all 12,500 four-year-olds in Montana.[55]
College debt rises while the state fails to invest in financial aid
Higher education is often the vehicle to reduce economic inequality by enabling everyone to achieve his or her potential. However, a college degree remains out of reach for many of our young adults. From 2003 to 2014, tuition and fees at Montana’s four-year colleges increased 55%.[56] While the Montana legislature has provided support over the past several years to allow 2-year and 4-year colleges to freeze tuition levels, the overall support for Montana’s most financially disadvantaged families has fallen behind those of nearly every other state.
Need-based aid is a critical component of access to college for low- and moderate-income families. Without sufficient investment in need-based aid, families are often left filling the gap with college loans. Nearly two-thirds of Montana students getting baccalaureate degrees are leaving college with debt, at an average amount more than $26,000.[57] The growing burden of student debt can slow college completion, particularly for lower-income families.[58]
Student debt and the lack of investment in need-based aid hurts our entire economy. Students saddled with higher debt may end up with lower credit scores, making it harder to get good jobs, become homeowners, or save for retirement.[59] In fact, a 30-year-old with student loan debt will have an average credit score 24 points lower than counterparts without student loan debt. More and more people with student loan debt are struggling to get mortgages, and this has a far-reaching impact on homeownership and economic growth in our communities.
Montana has fallen behind in providing low-income students with college grant aid. Montana’s investment in need-based aid (on a per-student basis) is less than one-fifth of the national average.[62] State investment in grant aid for undergraduate students represents only 2.2% of state expenditures on higher education (45th in the nation). As a result, more and more Montana students are taking on levels of debt that far exceed national averages. Montana can and should invest more to help disadvantaged students get a college education. For example, the tax cuts aimed at the wealthiest 1% (costing nearly $48 million in 2015) represented more than $1,500 in assistance per resident student enrolled in the Montana University System that year.[63]
Creating a state Earned Income Credit would help working Montana families
In Montana, thousands of working families are struggling to get by. One of the most promising ways to support them and boost our economy is the enactment of a state Earned Income Credit (EIC). The federal Earned Income Tax Credit (EITC) has been the most effective anti-poverty tool in U.S. history, and 26 states have created a state-level credit to provide additional economic support for families working for low pay.[64] Montana has over 27,000 families that work hard and still live near or below the federal poverty line of about $24,000 a year for a family of four.[65] Furthermore, Montana is one of only five states to impose income taxes on working families experiencing poverty.[66] Enacting a state EIC would help mitigate the impact these low taxation levels have on Montana’s families, and help put more Montanans on a path to the middle class.
By establishing a state Earned Income Credit, tied to the federal EITC, Montana could help over 80,000 working families.[67] Putting Montana’s EIC at 20% of the federal credit would cost approximately $32 million a year – money that would go into the pockets of working families and into our local economies and could be fully covered by eliminating the tax breaks for the wealthiest 1%.[68]
Policymakers should strengthen revenue levels to make public investments
Our best opportunity to realize economic growth for all Montanans is through investments in our communities across the state. There are fair and effective ways to raise the revenue needed to pay for these public investments. They include ending tax cuts and loopholes that benefit the wealthiest.
From 2001 to 2005, nearly 54% of the total growth in the state’s income came from the wealthiest 10% of taxpayers.[69] And yet, Montana has lost approximately $536 million in revenue over the past decade from tax cuts to the top 1% of taxpayers.[70]
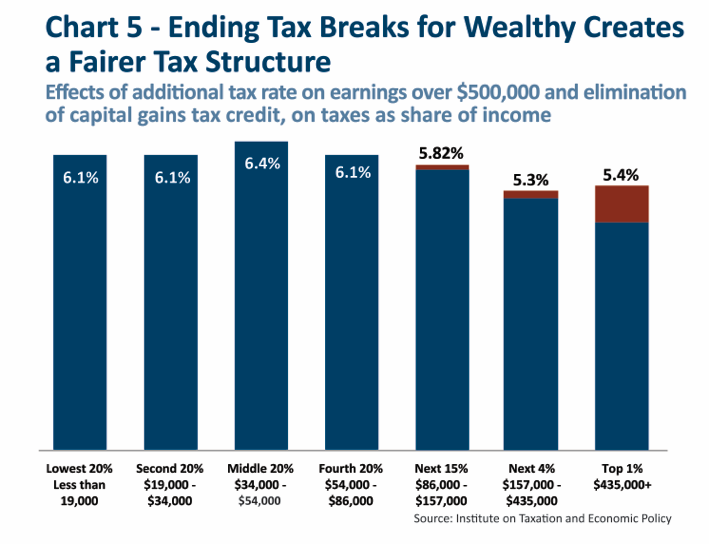
Montana would be a more prosperous state, with a brighter future for everyone, if a new top state income tax rate was imposed on those making more than $500,000 year, and by eliminating the capital gains tax loophole.
These two policy changes will mostly affect only the wealthiest 0.5% of Montana households -- approximately 2,500 taxpayers. As a result, the percent of total taxable income that is paid in taxes by high-income households would rise to be more in line with the rate paid by the rest of Montanans [see Chart 5]. And Montana would gain approximately $40 million per year in revenue, for much-needed public investments.
Conclusion
Investing today to keep our communities thriving will ensure the next generation of Montanans can succeed. However, these investments can only be made with adequate revenue levels. All Montanans benefit from taxes, but the wealthy have been provided tax breaks and tax loopholes that force our communities to suffer and working families to pick up the slack. Montana policymakers should reform Montana’s tax system, to ensure the wealthiest pay their share and carry their weight. This revenue can provide adequate resources for investments to benefit all Montanans and improve our state.
[1] U.S. Census Bureau. American Community Survey. “Children in Poverty.” 2009-2013 3-year estimates. Retrieved May 2016.
[2] Institute on Taxation and Economic Policy. Montana Personal Income Tax Revenue Lost, 2005-2016. April 2016. On file with author.
[3] Income Tax Reduction with Revenue from Limited Sales Tax, SB 407, Montana Legislature, 58th Session, 2003. http://leg.mt.gov/css/default.asp.
[4] “The Revenue and Taxpayer Impacts of the Income Tax Provisions of SB 407.” Montana Department of Revenue. December 2006. http://revenue.mt.gov/Portals/9/committees/2011_legislative_session/rev-tax-imp-sb407.pdf.
[5] “The Revenue and Taxpayer Impacts of the Income Tax Provisions of SB 407.” Montana Department of Revenue. December 2006. http://revenue.mt.gov/Portals/9/committees/2011_legislative_session/rev-tax-imp-sb407.pdf.
[6] “May 2015 State Occupational Employment and Wage Estimates: Montana.” Bureau of Labor Statistics. http://www.bls.gov/oes/current/oes_mt.htm#00-0000.
[7] The Revenue and Taxpayer Impacts of the Income Tax Provisions of SB 407. Montana Department of Revenue. December 2006. http://revenue.mt.gov/Portals/9/committees/2011_legislative_session/rev-tax-imp-sb407.pdf.
[8] “Revenue Impacts of SB 407.” Montana Department of Revenue. 2011.
[9] “Revenue Impacts of SB 407.” Montana Department of Revenue. 2011.
[10] The annual mean wage of a home health aide for 2015 is $22,500. Bureau of Labor Statistics. “May 2015 State Occupational Employment and Wage Estimates, Montana.” http://www.bls.gov/oes/current/oes_mt.htm#31-0000.
[11] “Revenue Impacts of SB 407.” Montana Department of Revenue. 2011.
[12] “Revenue Impacts of SB 407.” Montana Department of Revenue. 2011.
[13] “Revenue Impacts of SB 407.” Montana Department of Revenue. 2011.
[14] Institute on Taxation and Economic Policy. “Montana Personal Income Tax Revenue Lost, 2005-2016.” April 2016. On file with author.
[15] Memorandum by Dan Dodds, Montana Department of Revenue, to Senate Taxation Committee. March 24, 2011.
[16] “Capital Gains Tax Credit: Valuing Wealth Over Work in Montana.” Montana Budget and Policy Center. March 2013. http://www.montanabudget.org/wp-content/uploads/2013/10/Updated-Capital-Gains-Final.pdf.
[17] Bureau of Labor Statistics. “May 2015 State Occupational Employment and Wage Estimates: Montana.” http://www.bls.gov/oes/current/oes_mt.htm#00-0000.
[18] Author’s calculation. “Individual Income Tax Parameters.” Montana Department of Revenue. 2015. Retrieved May 2016. http://revenue.mt.gov/Portals/9/individuals/forms/2015_IITRates.pdf.
[19] Capital Gains Tax Credit: Valuing Wealth Over Work. Montana Budget and Policy Center, March 2013.
[20] Montana Department of Revenue. “Top 1% of Households, Total Income, Tax, and Capital Gains Income.” Accessed June 2016. Data on file with author.
[21] Montana Department of Revenue. “Biennial Report: July 1, 2012 – June 30, 2014.” December, 2014. http://revenue.mt.gov/Portals/9/publications/biennial_reports/2012-2014/BiennialReport-2012-2014.pdf.
[22] “Explaining the Difference Between the Forecast and Actual Impacts of Senate Bill 407 (2003 Legislative Session).” Montana Department of Revenue. January 2007.
[23] “Explaining the Difference Between the Forecast and Actual Impacts of Senate Bill 407 (2003 Legislative Session).” Montana Department of Revenue. January 2007.
[24] “Explaining the Difference Between the Forecast and Actual Impacts of Senate Bill 407 (2003 Legislative Session).” Montana Department of Revenue. January 2007.
[25] “The Revenue and Taxpayer Impacts of the Income Tax Provisions of SB 407.” Montana Department of Revenue. December 2006. http://revenue.mt.gov/Portals/9/committees/2011_legislative_session/rev-tax-imp-sb407.pdf.
[26] “The Revenue and Taxpayer Impacts of the Income Tax Provisions of SB 407.” Montana Department of Revenue. December 2006. http://revenue.mt.gov/Portals/9/committees/2011_legislative_session/rev-tax-imp-sb407.pdf.
[27] “Revenue Impacts of SB 407.” Montana Department of Revenue. 2011. https://revenue.mt.gov/Portals/9/publications/taxpolicy_researchreports/Revenue_Impact_SB407.pdf.
[28] “Revenue Impacts of SB 407.” Montana Department of Revenue. 2011. https://revenue.mt.gov/Portals/9/publications/taxpolicy_researchreports/Revenue_Impact_SB407.pdf.
[29] “Biennial Report: July 1, 2006 to June 30, 2008.” Montana Department of Revenue. January 13, 2009. https://revenue.mt.gov/Portals/9/publications/biennial_reports/2006-2008/BiennialReport_2006-2008.pdf.
[30] “Biennial Report: July 1, 2012 – June 30, 2014.” Montana Department of Revenue. December 2014. http://revenue.mt.gov/Portals/9/publications/biennial_reports/2012-2014/BiennialReport-2012-2014.pdf.
[31] “Montana Personal Income Tax Revenue Lost, 2005-2016.” Institute on Taxation and Economic Policy. April 2016. On file with author.
[32] Memorandum from Dan Dodds, Senior Economist, to Mike Kadas, Director, Montana Department of Revenue. “SB 407 and Employment.” February 1, 2013. https://revenue.mt.gov/Portals/9/publications/taxpolicy_researchreports/Employment_Study.pdf
[33] Dennison, Mike. “Tax cuts led to surplus, GOP says.” The Missoulian. February 19, 2006. http://missoulian.com/news/state-and-regional/tax-cuts-led-to-surplus-gop-says/article_103e8207-732b-5162-b5f1-cd8f52013e53.html.
[34] “Senate Bill 407 Did Not Expand the Economy.” Montana Budget and Policy Center. March 19, 2009. http://www.montanabudget.org/senate-bill-407-did-not-expand-the-economy/.
[35] “Senate Bill 407 Did Not Expand the Economy.” Montana Budget and Policy Center. March 19, 2009. http://www.montanabudget.org/senate-bill-407-did-not-expand-the-economy/.
[36] Leachman, M., Mazerov, M. “State Personal Income Tax Cuts: Still a Poor Strategy for Economic Growth.” Center on Budget and Policy Priorities. May 14, 2015. http://www.cbpp.org/research/state-budget-and-tax/state-personal-income-tax-cuts-still-a-poor-strategy-for-economic.
[37] Leachman, M., Mazerov, M. “State Personal Income Tax Cuts: Still a Poor Strategy for Economic Growth.” Center on Budget and Policy Priorities. May 14, 2015. http://www.cbpp.org/research/state-budget-and-tax/state-personal-income-tax-cuts-still-a-poor-strategy-for-economic.
[38] Montana Office of Public Instruction Website. District Expenditures and Revenue Core Files. Selected “Revenues by Enrollment Category, 1994-2015.” Montana Office of Public Instruction. Retrieved April 2016.
[39] Montana Office of Public Instruction. Per Pupil Revenue and Expenditure Definitions. Retrieved May 2016. http://gems.opi.mt.gov/SchoolFinance/Pages/PerPupilDefinitions.aspx.
[40] Montana Department of Administration. “State of Montana: K-12 Public Schools Facility Condition Assessment A/E Project #26-30-03.” July 1, 2008. http://opi.mt.gov/pdf/Facilities/Final_Report_7-1-08.pdf. The report, conducted by DLR Group, includes a 30 percent sampling of all school facilities in the state, which is statistically indicative to statewide trends.
[41] Crampton, F. and Thompson, D. “Building Minds, Minding Buildings: School Infrastructure Needs.” American Federation of Teachers. December 2008. http://files.eric.ed.gov/fulltext/ED517698.pdf.
[42] “Fiscal Report for the 2017 Biennium,” June 2015, Volume 4, p. 8, http://leg.mt.gov/fbp-2017.asp.
[43] “2014 Report Card for Montana’s Infrastructure.” American Society of Civil Engineers (ASCE) Montana Section. http://www.infrastructurereportcard.org/wp-content/uploads/2014/11/2014-Report-Card-for-Montanas-Infrastructure.pdf.
[44] “2014 Report Card for Montana’s Infrastructure.” American Society of Civil Engineers (ASCE) Montana Section. http://www.infrastructurereportcard.org/wp-content/uploads/2014/11/2014-Report-Card-for-Montanas-Infrastructure.pdf.
[45] “2014 Report Card for Montana’s Infrastructure.” American Society of Civil Engineers (ASCE) Montana Section. http://www.infrastructurereportcard.org/wp-content/uploads/2014/11/2014-Report-Card-for-Montanas-Infrastructure.pdf.
[46] “2014 Report Card for Montana’s Infrastructure.” American Society of Civil Engineers (ASCE) Montana Section. http://www.infrastructurereportcard.org/wp-content/uploads/2014/11/2014-Report-Card-for-Montanas-Infrastructure.pdf.
[47] “2014 Report Card for Montana’s Infrastructure.” American Society of Civil Engineers (ASCE) Montana Section. http://www.infrastructurereportcard.org/wp-content/uploads/2014/11/2014-Report-Card-for-Montanas-Infrastructure.pdf.
[48] “2014 Report Card for Montana’s Infrastructure.” American Society of Civil Engineers (ASCE) Montana Section. http://www.infrastructurereportcard.org/wp-content/uploads/2014/11/2014-Report-Card-for-Montanas-Infrastructure.pdf.
[49] “2014 Report Card for Montana’s Infrastructure.” American Society of Civil Engineers (ASCE) Montana Section. http://www.infrastructurereportcard.org/wp-content/uploads/2014/11/2014-Report-Card-for-Montanas-Infrastructure.pdf.
[50] Montana Department of Transportation. “Montana’s Approach to Asset Management: MDT’s Performance Programming Process.” Presented to the Revenue and Transportation Interim Committee. December 1, 2015. http://leg.mt.gov/content/Committees/Interim/2015-2016/Revenue-and-Transportation/Meetings/Nov-2015/asset-management-zanto.pdf.
[51] “2014 Report Card for Montana’s Infrastructure.” American Society of Civil Engineers (ASCE) Montana Section. http://www.infrastructurereportcard.org/wp-content/uploads/2014/11/2014-Report-Card-for-Montanas-Infrastructure.pdf.
[52] Barnett, S., et al. “The State of Preschool: 2015.” National Institute for Early Education Research. 2016. http://nieer.org/research/state-preschool-2015.
[53] Montana Budget and Policy Center, “The High Cost of Child Care: State Funding for Pre-K Would Benefit Montana Families,” May 2014. http://www.montanabudget.org/wp-content/uploads/2014/05/HighCostofChildCare.pdf
[54] Great Falls Tribune, “Bullock promotes ‘early edge’ plan for kids,” October 15, 2014, http://www.greatfallstribune.com/story/news/local/2014/10/14/bullock-promotes-early-edge-plan-kids/17271315/.
[55] See Montana Budget and Policy Center. “Strengthening Families, Strengthening Our Economy: The Economic Benefits of Pre-Kindergarten.” September 2014. http://www.montanabudget.org/economic_benefits_of_pre-k/. We estimate that an annual investment of $26.7 million would provide a universal pre-K program for all four-year-olds in Montana, factoring in current enrollment within Head Start and estimated enrollment level of 75 percent.
[56] “Affordability Indicators: Price, Financial Aid, and Student Debt in the Montana University System.” Office of the Commissioner of Higher Education. 2014. http://www.mus.edu/board/meetings/2014/May2014/AffordabilityIndicators-Price,FinAidDebt2014.pdf.
[57] “Affordability Indicators: Price, Financial Aid, and Student Debt in the Montana University System.” Office of the Commissioner of Higher Education. 2014. http://www.mus.edu/board/meetings/2014/May2014/AffordabilityIndicators-Price,FinAidDebt2014.pdf.
[58] Dwyer, R., McCloud, L., and Hodson, R. “Debt and Graduation from American Universities.” Oxford Journals. June 15, 2012. https://financialcapability.files.wordpress.com/2012/03/debt-and-graduation-dwyer-mccloud-hodson-circ2.pdf
[59] Gale, W., et al. “Student Loan Rising: An Overview of Causes, Consequences, and Policy Options.” Tax Policy Center, Urban Institute and Brookings Institution. May 2014. http://www.brookings.edu/~/media/research/files/papers/2014/05/student-loan-debt-rising-gale-harris/student_loans_rising_gale_harris_09052014.pdf.
[60] Franke, R. “Toward the Education Nation? Revisiting the Impact of Financial Aid, Education Experience, and Institutional Context on Baccalaureate Degree Attainment for Low-Income Students.” American Educational Research Association. April 3, 2014. http://www.aera.net/Portals/38/Newsroom%20-%20Recent%20Research/Updated%20Towards%20the%20Education%20Nation.pdf.
[61] Franke, R. “Toward the Education Nation? Revisiting the Impact of Financial Aid, Education Experience, and Institutional Context on Baccalaureate Degree Attainment for Low-Income Students.” American Educational Research Association. April 3, 2014. http://www.aera.net/Portals/38/Newsroom%20-%20Recent%20Research/Updated%20Towards%20the%20Education%20Nation.pdf.
[62] “45th Annual Survey Report on State-Sponsored Student Financial Aid: 2013-2014.” National Association of State Student Grant and Aid Programs.
[63] “Fiscal Year Enrollment – Summary Report.” Montana University System. May 5, 2016. https://mus.edu/data/enrollment/MUS%20Fiscal%20Year%20FTE%20(FY06-FY16)%20-%20Summary.pdf.
[64] Arloc Sherman, Danilo Trisi, and Sharon Parrott. Various Supports for Low-Income Families Reduce Poverty and Have Long-Term Positive Effects on Families and Children. Center on Budget and Policy Priorities. July 2013. http://www.cbpp.org/cms/?fa=view&id=3997
[65] United States Census Bureau. 2013 American Community Survey 1- Year Estimates. Montana Economic Characteristics.
[66] Phil Oliff, Chris Mai, and Nicholas Johnson. The Impact of State Income Taxes on Low-Income Families in 2011. Center On Budget and Policy Priorities. April 2012. http://www.cbpp.org/cms/?fa=view&id=3740
[67] Internal Revenue Service. Earned Income Tax Credit. Statistics for Tax Returns with EITC. 2013.
http://www.eitc.irs.gov/EITC-Central/eitcstats
[68] Costs forecaster for FY 2015. Erica Williams and Michael Leachman. How Much Would a State Earned Income Tax Credit Cost in FY 2015? Center on Budget and Policy Priorities. December 2013. http://www.cbpp.org/cms/index.cfm?fa=view&id=2992
[69] “Explaining the Difference Between the Forecast and Actual Impacts of Senate Bill 407 (2003 Legislative Session).” Montana Department of Revenue. January 2007.
[70] “Montana Personal Income Tax Revenue Lost, 2005-2016.” Institute on Taxation and Economic Policy. April 2016. On file with author.
MBPC is a nonprofit organization focused on providing credible and timely research and analysis on budget, tax, and economic issues that impact low- and moderate-income Montana families.